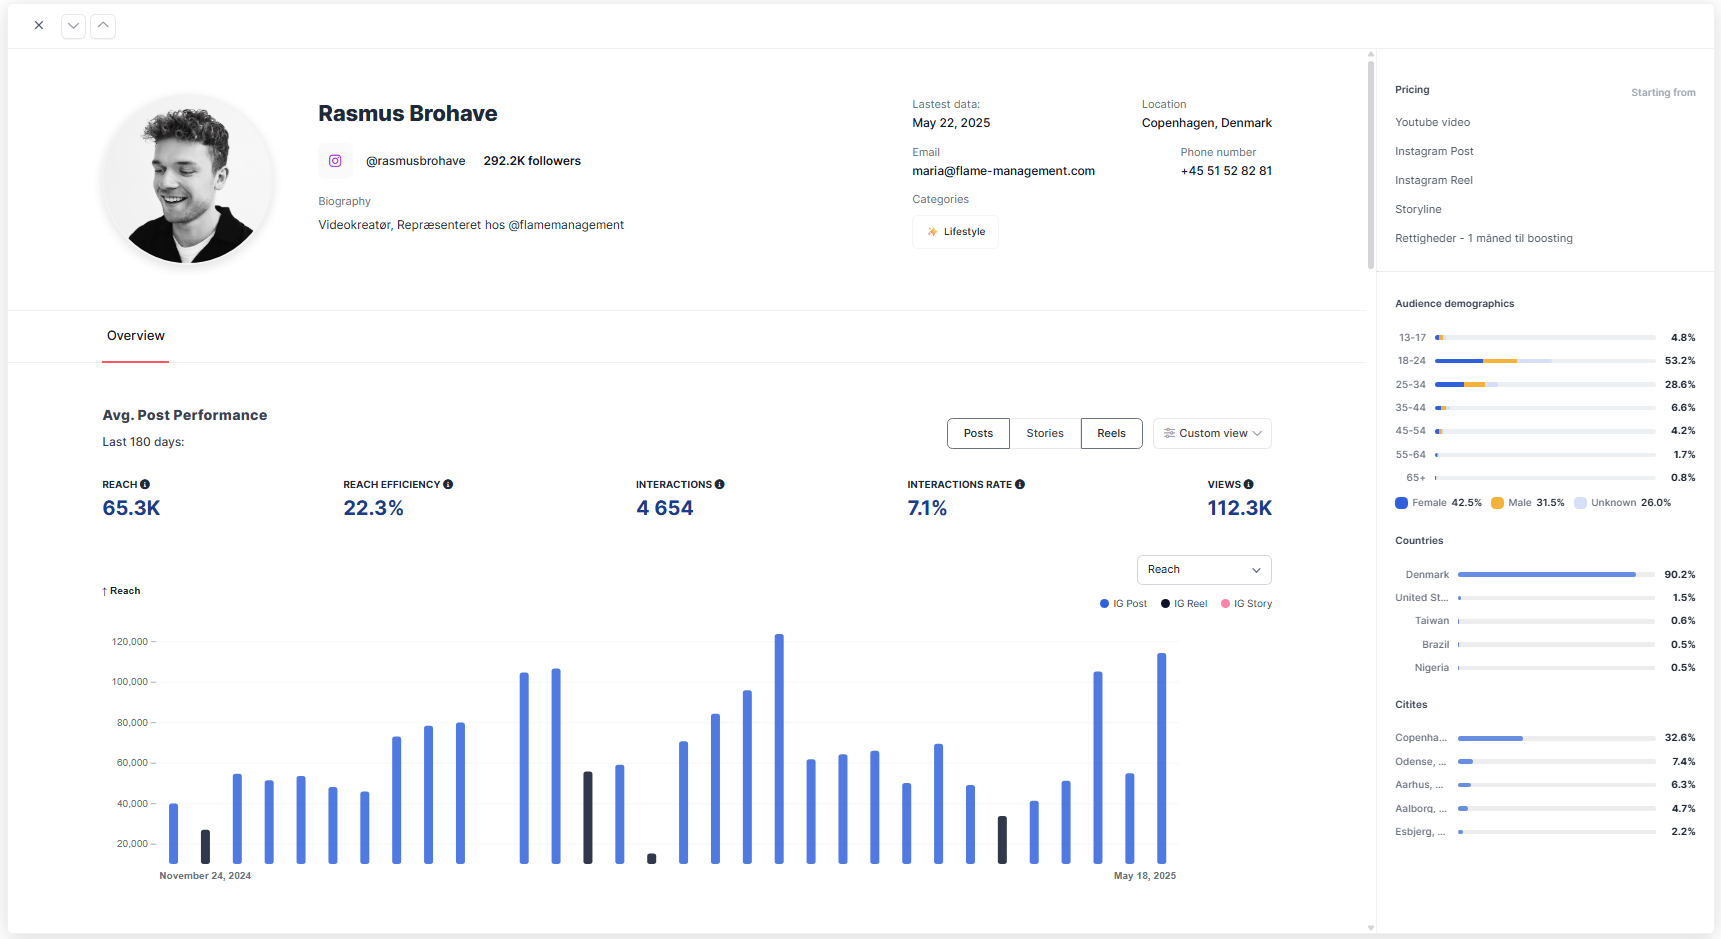
- Follower audience vs. engaged audience demographics - View details of the creator’s audience with age groups, gender, country, and top five cities either by the creator’s follower audience or engaged audience
Tip! While follower audience gives you a clear indication of who follows the creator, engaged audience provides more details in the direction that the platforms algorithm pushes the content.
- Average post performance - A detailed overview of a creator’s average post performance over the past 180 days. For Instagram, you can choose to analyze performance by Posts, Stories, or Reels, while TikTok simply provides overall performance.
- Sponsored vs. non-sponsored posts - An important tool to directly compare how the influencer performs in day-to-day content versus paid brand collaborations.
- Blue text shows the performance of normal (organic) content
- The number below shows the benchmark for paid collaborations. You can also go to “Custom View” and enable the “Sponsored” toggle to view performance only for sponsored posts.
- Sponsored vs. non-sponsored posts - An important tool to directly compare how the influencer performs in day-to-day content versus paid brand collaborations.
- Reach - The average number of unique accounts that viewed the content. This helps gauge the creator’s ability to consistently get their content in front of people.
- Reach Efficiency - How well the influencer converts their follower base into actual viewers. It’s calculated as Reach divided by Follower Count, expressed as a percentage. A higher Reach Efficiency means the influencer’s content is regularly seen by a large portion of their audience.
- Interactions - The average number of engagements per post such as likes, comments, saves, shares.
- Interaction Rate - Interactions divided by Reach, offering a normalized metric that compares creators of different sizes on an even playing field.
- Views - The total number of times the content was viewed, also known as impressions.