Overview of reports section
Here’s what you’ll find in the Reports section:- Key Metrics - Reach, engagement rate, and views.
- Performance Timeline - See how campaign results evolve over time.
- Post Summary & Deep Dive - From quick glances to detailed insights.
- Report Editing - Tailor the report to fit your needs.
- Export & Share - Distribute your report however you need.
Key metrics
Track core campaign performance with automatically calculated stats - updated in real time:- Reach - Total unique viewers.
- Reach Efficiency - The influencers total reach of campaign posts relative to the size of their follower base. A good metric for estimating actual vs. estimated performance.
- Interactions - Total number of interactions on the campaign.
- Interaction Rate - The percentage of reach that interacts with content.
- Views - Total number of views, repeat or unique.
- Average Watch Time - For reels and TikTok videos, this metric shows the average time spent watching the video in seconds. Get an idea of whether people are staying to watch the video!
- Total Watch Time - For reels and TikTok videos, this gives the total amount of time spent watching the video by mutiplying Reach with Average Watch Time. See whether your audience spent days, weeks or perhaps months in total watch time with your brand!
- Navigations - For IG stories, see insights as to how peope navigate. Do they tap back to see the stories again, tap forward to skip, swipe forward to skip the entire creators storyline, or tap exit to no longer view stories.
- Note! We particular encourage highlighting tap backs for story heavy campaigns, as this actively shows the audience going back to view the content, meaning they were interested!
- Link Clicks - Link clicks has to be manually added to the report, as this data is not provided. However, once entered under a content piece in Sheer it will be included in the report itself.
- Pricing - Pricing has to be manually added to the report. This allows to track the cost of an influencer compared to results. This can be applied to the collaboration as a whole, or under each specific content piece to get insights as to whether a reel or carrousel post was the most cost-effective. Further pricing filters include:
- CPM (cost per 1000 views).
- CPE (Cost per engagement).
Performance timeline
View how posts and engagement accumulate throughout the campaign. By default, this is set to show the overall timeline and performance to see how the number of views on your campaign has grown over time. Different influencers are highlighted with different colors to give a distinct overview of each influencer’s performance in your campaign.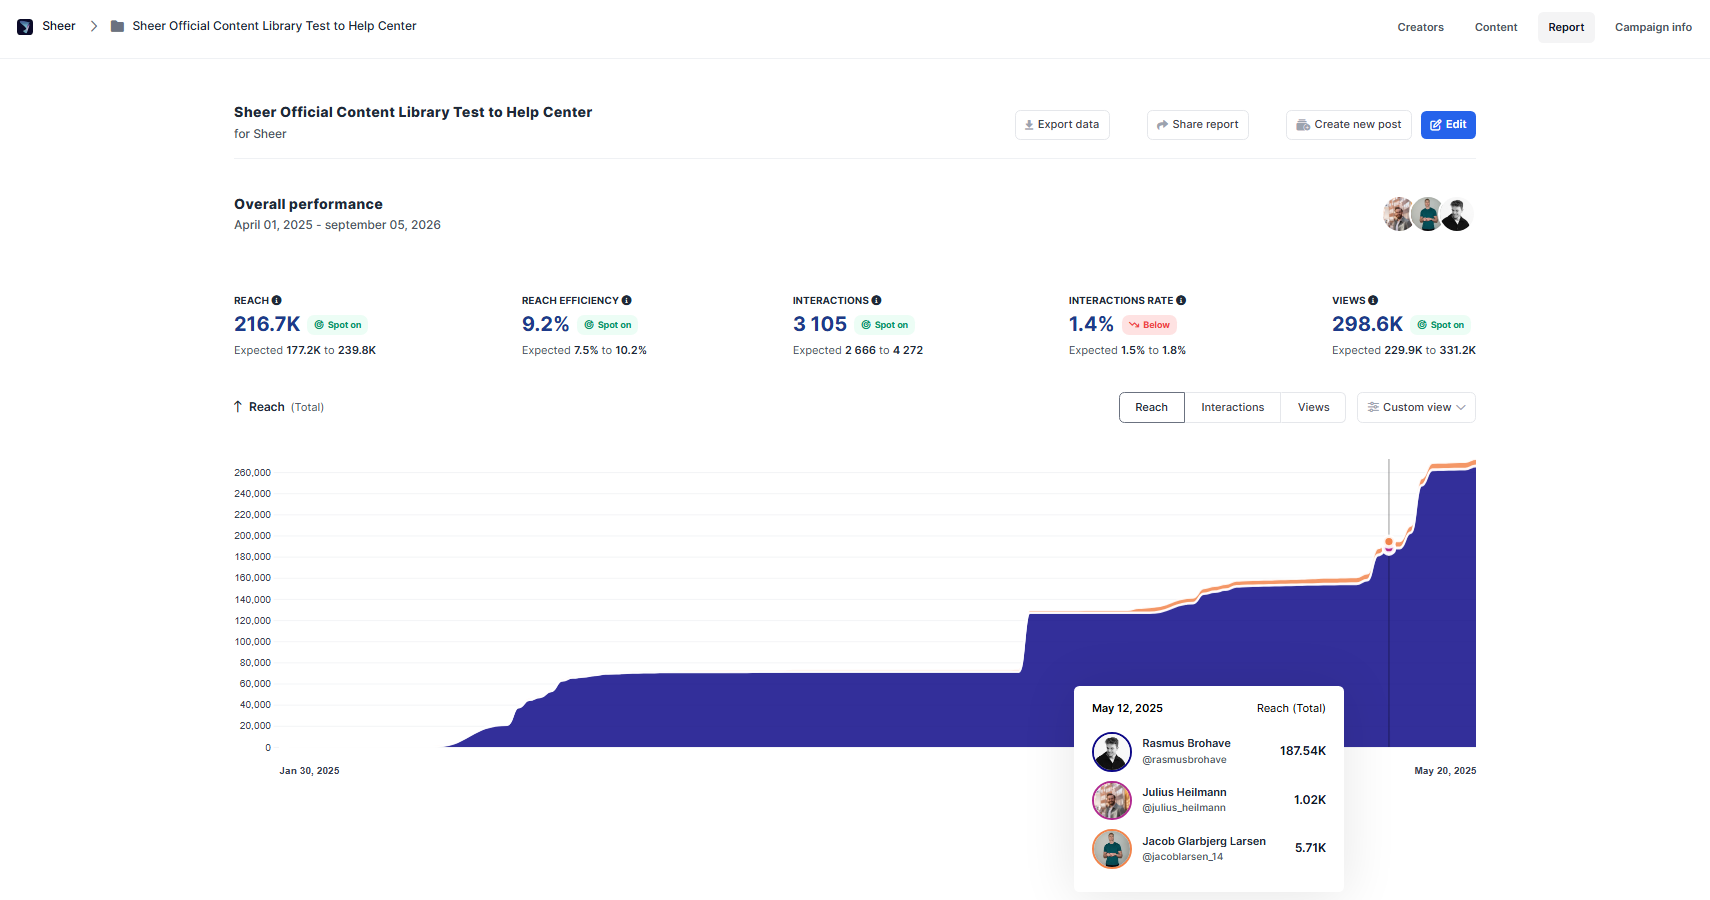
Organic vs. boosted performance data
Since data is pulled directly from Sheer, all organic data is provided directly from the platform, whether Meta or TikTok. However, if paid media is applied on a post, then the data in Sheer varies based on if your creator is on Instagram or TikTok- Instagram - influencer data is always organic data. Sheer will differentiate between organic and paid performance, and only show organic performance.
- TikTok - Influencer data shown is both organic and paid together. This means that if paid media is applied, Sheer will not be able to differentiate between the data.
Tip! If you plan to add paid media on your TikTok campaign, then export the report data, or simply grab a screenshot of the influencers specific post that is to be boosted. That ensures you also have the organic data available at later stages of reporting.