Overview of reports

Here’s what you’ll find in the Reports section:

  • Key Metrics – Like reach, engagement rate, and impressions.
  • Performance Timeline – See how campaign results evolve over time.
  • Post Summary & Deep Dive – From quick glances to detailed insights.
  • Report Editing – Tailor the report to fit your needs.
  • Export & Share – Distribute your report however you need.
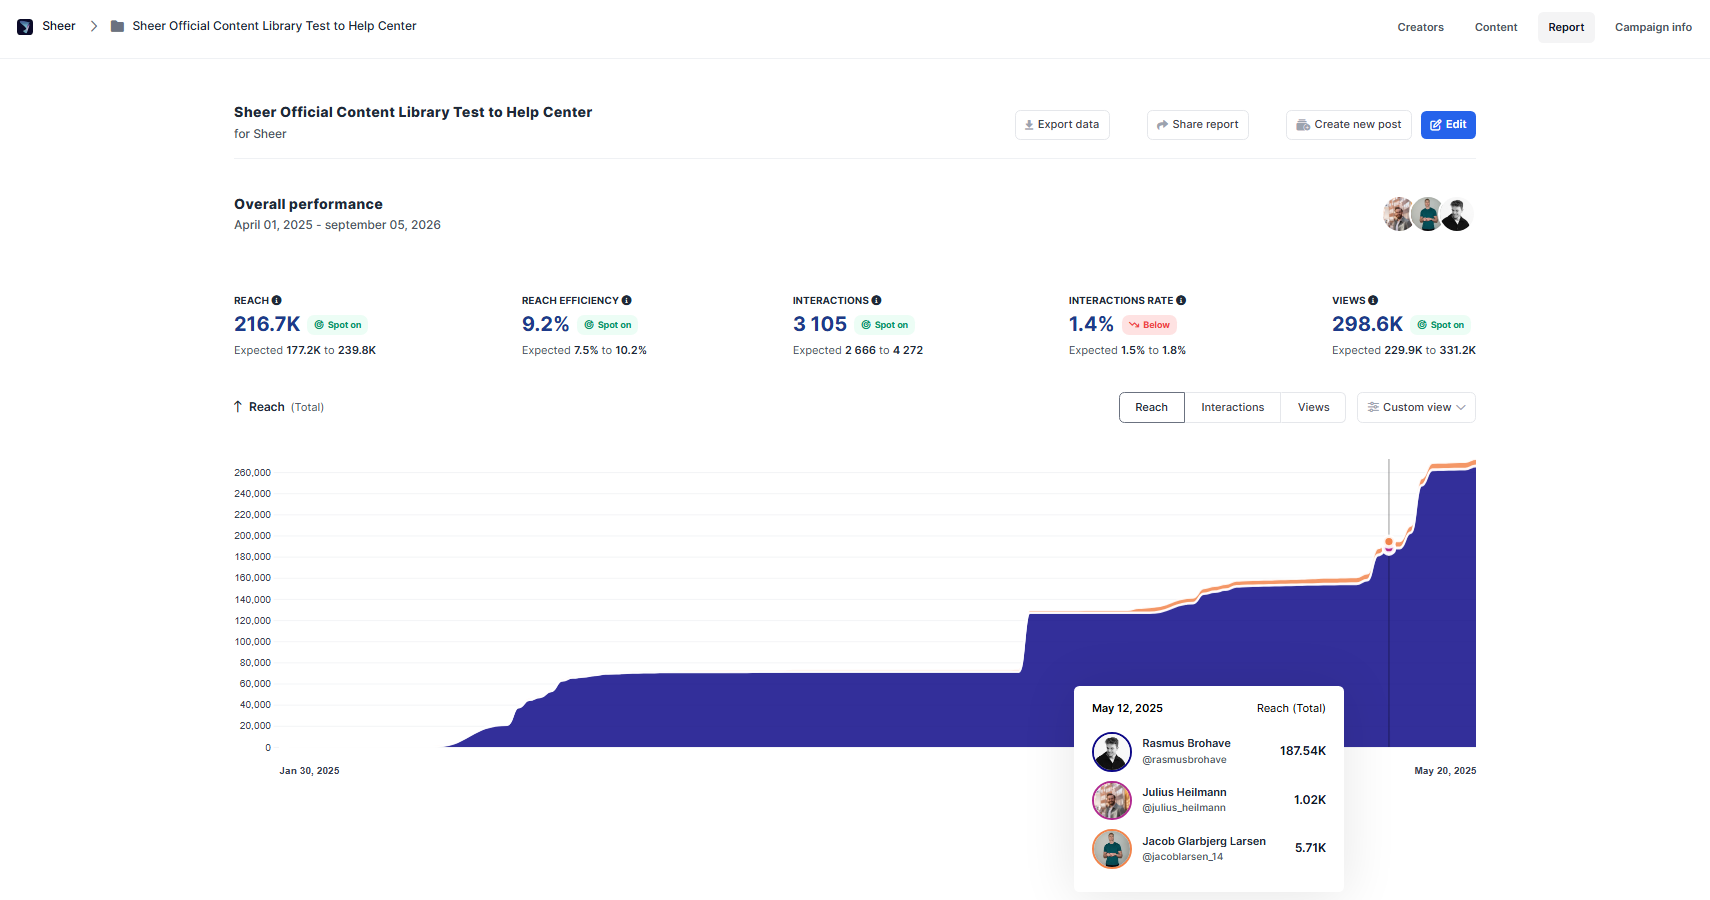
Key Metrics

Track core campaign performance with automatically calculated stats - updated in real time:

  • Reach – Total unique viewers.
  • Reach efficiency - The influencers total reach of campaign posts relative to the size of their follower base. A good metric for estimating actual vs. estiamted performance.
  • Engagement Rate – Interactions per reach.
  • Impressions – Total number of views, repeat or unique.

Performance Timeline

View how posts and engagement accumulate throughout the campaign. By default, this is set to show to overall timeline and performance to see how the number of views on your campaign has grown over time.

Different influencers are highlighted with different colors to give a distict overview of each inlfuencers performance in your campaign.

Edit report

Adding new influencer posts to your report can be done in an instant. Simply select the Edit Report button, scroll down to the influencer and click add post.

You may now select posts, stories or reels. With stories, as long as the influencer is connected to Sheer, you can always add stories that have expired on the influencers profile to your report at a later date.

You may also edit what key metrics you wish to track on your desired report based on what specific KPI’s you have set.

Post summary & Post deep dive

Get a bird’s-eye view of all influencer posts. You have both the option to view an influencers accumilated performance of all their posts, or you can scroll further down to the influencer to get a overview of their performance of all individuel posts.

For the full details on a singular post, simply select the specific post for a full breakdown - see likes, comments, shares, saves, and impressions, and more. Ideal for understanding what’s working and why.

Export & share report

Download by exporting it into an Excel format. Great for deeper analysis or importing into other tools.

You may also share the report directly by editing the report to be either public or password protected. This provides specific personal outside of your organization access to this individual report in browser, allowing them the full overview of the report without access to other Sheer functions.